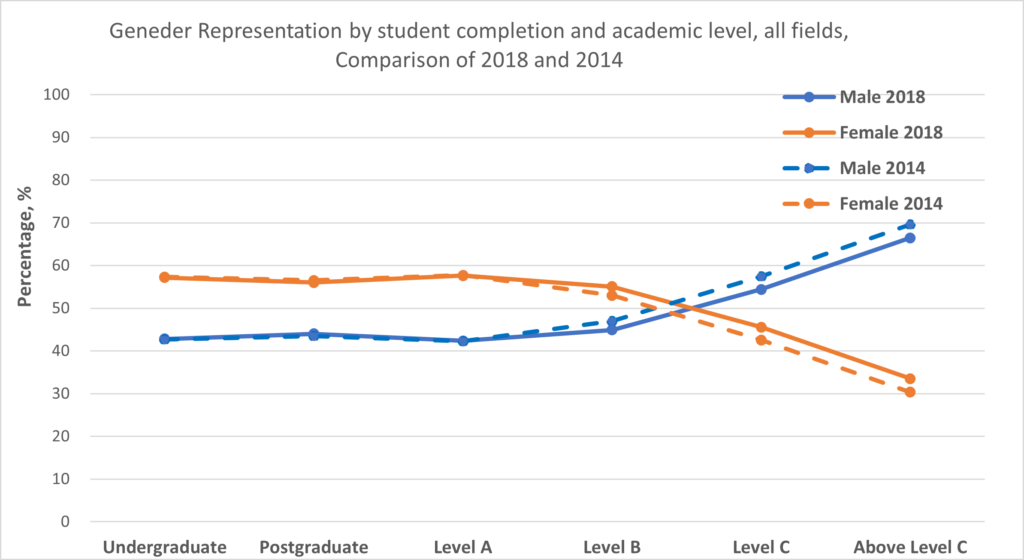
Across all fields in 2014 and 2018, from undergraduates to mid-career academics at Level C, women made up 40–60% of people at each level. That means the overall academic gender profile at those levels falls within our acceptable range of at least 40% men, 40% women and 20% people of any gender.
However, in disciplines like engineering, the proportion of men never dropped below 75%. This paints a very different picture to the overall data.
In this post, we’re putting the spotlight on Information Technology (IT) in recognition of the 10th anniversary of Girls in ICT Day on the 22nd of April 2021. Held on the fourth Thursday in April each year, the United Nations International Telecommunication Union (ITU) uses this day to promote technology career opportunities for girls and women in the world’s fastest growing sector.
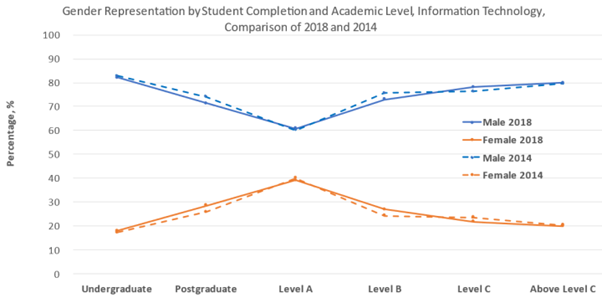
Based on the scissor graph above, it’s immediately obvious that IT is a male-dominated discipline, with the proportion of men never falling below 60%. There’s very little change between the 2014 and 2018 data, but there are slight improvements in female representation amongst postgraduates and at Level B, and a small decline at Level C.
Interestingly, the proportion of women at Level A is double the proportion of female undergraduates, but there is a significant drop-off beyond these levels.
This decline mirrors the overall picture, where female representation decreases from Level B onwards. However, the spike in female representation at Level A seems unique to IT—the proportion of women at junior levels remains very consistent when all disciplines are considered (Figure 2).
This suggests that women are taking up postgraduate study and early career academic roles in IT, but face gendered workplace barriers that prevent them from reaching senior academic positions. We need to do more to stem the loss of women between Levels A and B in IT.
While you’re here, check out our Q&A with Dr Arti Agrawal, Director of the UTS Women in Engineering and IT Program. In the interview, Arti talks about the program’s initiatives for girls and women at all stages in their trajectory – from primary school through high school and university, all the way to industry professionals and professors.
For more activities and ways to get girls involved in IT, take a look at ITU’s toolkit for organising a Girls in ICT event.