Has women’s representation in higher education improved over the course of the SAGE pilot? It’s still early days, but data from the Department of Education, Skills and Employment (DESE) show promising signs of progress.
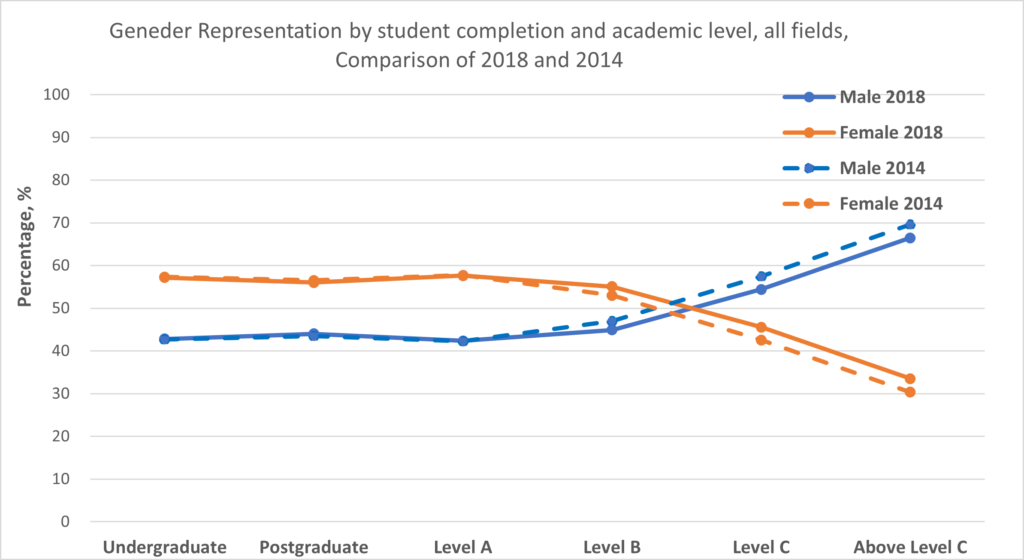
From the scissor graph above, we can see that the gender ratios of students and Level A academic staff didn’t change much between 2014 and 2018. At Level B and above, however, there were visible increases in women’s representation. The greatest increase was observed amongst academic staff above Level C. There is, however, still a long way to go to achieve equitable representation at senior levels.
When all disciplines are considered, women make up the majority of undergraduate and postgraduate students, and Level A and B academics. This trend is reversed at Level C and above. However, if we consider gender balance to be 40% women, 40% men, 20% people of any gender, the gender distribution at Level C still falls within the acceptable range; gender inequity is only apparent above Level C (i.e. at Levels D and E). Applying a 40:40:20 approach is inclusive of those identifying outside of the gender binary, which is a key principle of the Athena Swan Charter. Compared to a 50:50 approach, it also better accommodates minor fluctuations and is more realistic when working with small numbers.
These changes in gender representation suggest good news for the sector, but there are limits to what this data can tell us. Academic staff numbers at Level D and above are only provided as an aggregate in this data set, so it’s unclear what the gender distribution looks like at each individual level. While we suspect that the number of women decreases as level increases, disaggregated data is essential to verify this – and herein lies an important attribute of the Athena Swan approach.
Furthermore, the DESE data appears to exclude research-only staff.[1] We know from SAGE Athena Swan Bronze Award applications that women are generally underrepresented amongst research-only staff and overrepresented in teaching-only staff. This will likely mean that women’s representation is inflated in this data set. And, of course, this data set only captures binary gender data.[2] We suspect that disaggregation by all genders would not change the overall picture substantially, but nonetheless, it’s important to acknowledge the limitation.
Are some disciplines making more progress towards gender equity than others? In a future post, we’ll take a closer look at how the gender gap has changed in the Engineering disciplines.
[1] DESE Staff Time Series | Definitions and Notes: Data Notes
[2] The data notes for the student data state that “Students who have requested their gender to be recorded as neither male nor female are counted as female.” We could find no indication that this is different for the staff data.