In a previous post, we examined the male-to-female ratio of all university staff and students in 2014 and 2018. From undergraduates through to mid-career academics at Level C, we found that women comprised between 40% to 60% of people at each level for both years.
Since we consider 40% to 60% an acceptable range for men’s or women’s representation, this paints a mostly rosy picture of gender distribution in Australian higher education. But if you’ve ever been to a physics or nursing class, you would know that the gender composition of academic staff and students varies wildly by discipline.
In this post, we’ll discuss a classic example of a discipline with a very pronounced and persistent gender skew: engineering. Of all the disciplines we studied,[1] the largest male/female gender gap was observed here.
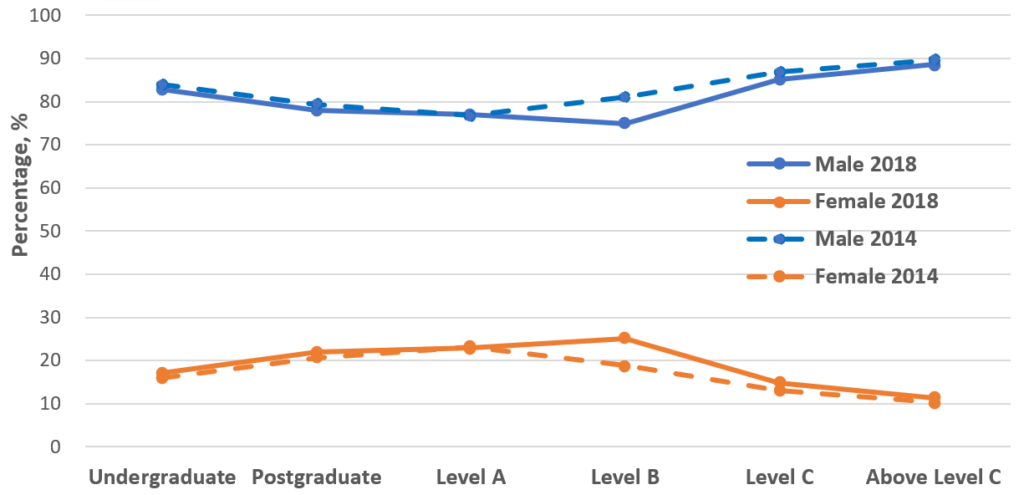
Let’s take a look at the scissor graph in Figure 1. The first thing we notice is that the overwhelming majority of engineering staff and students are male. This is true at every level: the proportion of men never drops below 75%. We also see that the relative proportions of men and women at each level are quite similar in 2014 and 2018. It’s only at Level B that we observe any significant increase in the proportion of women.
The lack of female students in engineering is particularly striking because when it comes to university student enrolments and completions, women outnumber men in almost every other discipline.[2] Generally, the proportion of women in a discipline starts to fall below 40% after Level B or C, which suggests that there are challenges in career progression or workplace culture that disproportionately affect women. In other words, most disciplines struggle to retain women long enough for them to fill senior academic positions.
That’s not to say that such challenges don’t exist in engineering. Rather, the data indicate that there are bigger barriers to attracting women to study engineering in the first place.
According to the 2019–20 Youth in STEM Research data, compared to girls between the ages of 12 and 13, a smaller proportion of girls aged 14 to 17 declared interest and confidence in engineering as a subject.[3] Curiously, this was not the case for other STEM subjects, where similar levels of interest and confidence were reported by older and younger girls. In both age groups, boys were more likely than girls to say they were interested in engineering, and to feel that they would perform well in those subjects.
It’s also noteworthy that in the 12 to 13 age group, nearly equal proportions of girls and boys aspired to become engineers (14% and 15% respectively). In the 14 to 17 age group however, a gender gap emerges: only 7% of girls indicated they would pursue an engineering career, compared to 20% of boys. For women aged 18 to 21, that figure is even lower – merely 5% stated they would like a career as an engineer. It’s hardly surprising, then, that less than 20% of engineering undergraduates in 2014 and 2018 were women.
These findings suggest that efforts to draw more women into engineering should target early or pre-secondary students and aim to develop and maintain girls’ interest in engineering throughout high school. Many universities do have school outreach programs to encourage girls to consider further study and careers in engineering. The University of Technology Sydney, for example, runs a suite of programs for primary and high school students as part of their Women in Engineering and IT initiative. Likewise, the University of Western Australia delivers the Girls in Engineering outreach program, where current UWA students and industry partners visit Years 7 to 12 students in schools and guide them through exciting engineering challenges.
For those wishing to improve their engineering outreach programs, researchers from Monash University offer the following advice:[4]
- Long-term interventions (at least 12 weeks) are necessary to achieve sustained change. For this reason, the UTS engagement programs are designed to be multi-touchpoint instead of one-off events.
- Measure long-term impact by collecting longitudinal data. We need to know if the students who participate in these programs go on to study engineering when they’re older and if not, why not?
- Emphasise the importance of non-academic qualities such as interpersonal skills and empathy to becoming a successful engineer.
- Focus explicitly on engineering instead of science and maths in general. Choose activities or examples that have high personal relevance and social appeal. The University of Queensland’s Women in Engineering program includes workshops that showcase engineering as a way to help people and solve real-world problems. Participating students get to build prosthetic limbs, design affordable flood-proof housing and improve healthcare access for remote communities.
Notes and references
[1] To gauge the differences in gender composition between academic disciplines, we created separate scissor graphs (like the one in Figure 1) for ten Academic Organisational Unit Groups, as defined by DESE, namely: 1) Natural and Physical Sciences, 2) Information Technology, 3) Engineering and Related Technologies, 4) Architecture and Building, 5) Agriculture, Environmental and Related Studies, 6) Health, 7) Education, 8) Management and Commerce, 9) Society and Culture and 10) Creative Arts.
It’s important to note that Academic Organisational Unit Groups are fairly broad categories; for example, Natural and Physical Sciences encompass mathematical sciences, physics and astronomy, chemical sciences, earth sciences, biological sciences and other natural and physical sciences. Thus, there are likely to be variations in the gender composition between the sub-disciplines in each Group as well.
[2] Department of Education, Skills and Employment, Higher Education Data Cube (uCube).
[3] See also: Department of Industry, Innovation and Science (2020) Youth in STEM Research 2019–20: Summary of Results.
[4] Corrigan D and Aikens K (2020) Barriers to participation in engineering and the value of interventions to improve diversity, report to the Engineering for Australia Taskforce, Monash Education Futures.