UniSQ’s SAGE Athena Swan self-assessment process and Bronze Award application highlighted the need for higher employee engagement with equity, diversity and inclusion (EDI) issues and initiatives to support a broad, sustainable shift in EDI culture across the institution. It also identified that the collection and accessibility of diversity data was critical to the development and refinement of future actions.
To this end, a key priority outlined in the UniSQ SAGE Action Plan was the development of a dedicated SAGE dashboard/website as a ‘one-stop shop’ for employees to review information and progress relevant to the SAGE program (Action 1.3).
Addressing information and data visibility
After broad consultation with the University’s SAGE Committee and other stakeholders, UniSQ’s SAGE Coordinator worked closely with a web developer in 2021 to develop a comprehensive SAGE dashboard. The dashboard outlines the history of SAGE Athena Swan internationally and in Australia; the trajectory of UniSQ’s SAGE journey to date; an overview of the Action Plan’s major themes and related actions; and opportunities for employees to access external EDI resources, as well as get involved with SAGE initiatives at UniSQ.
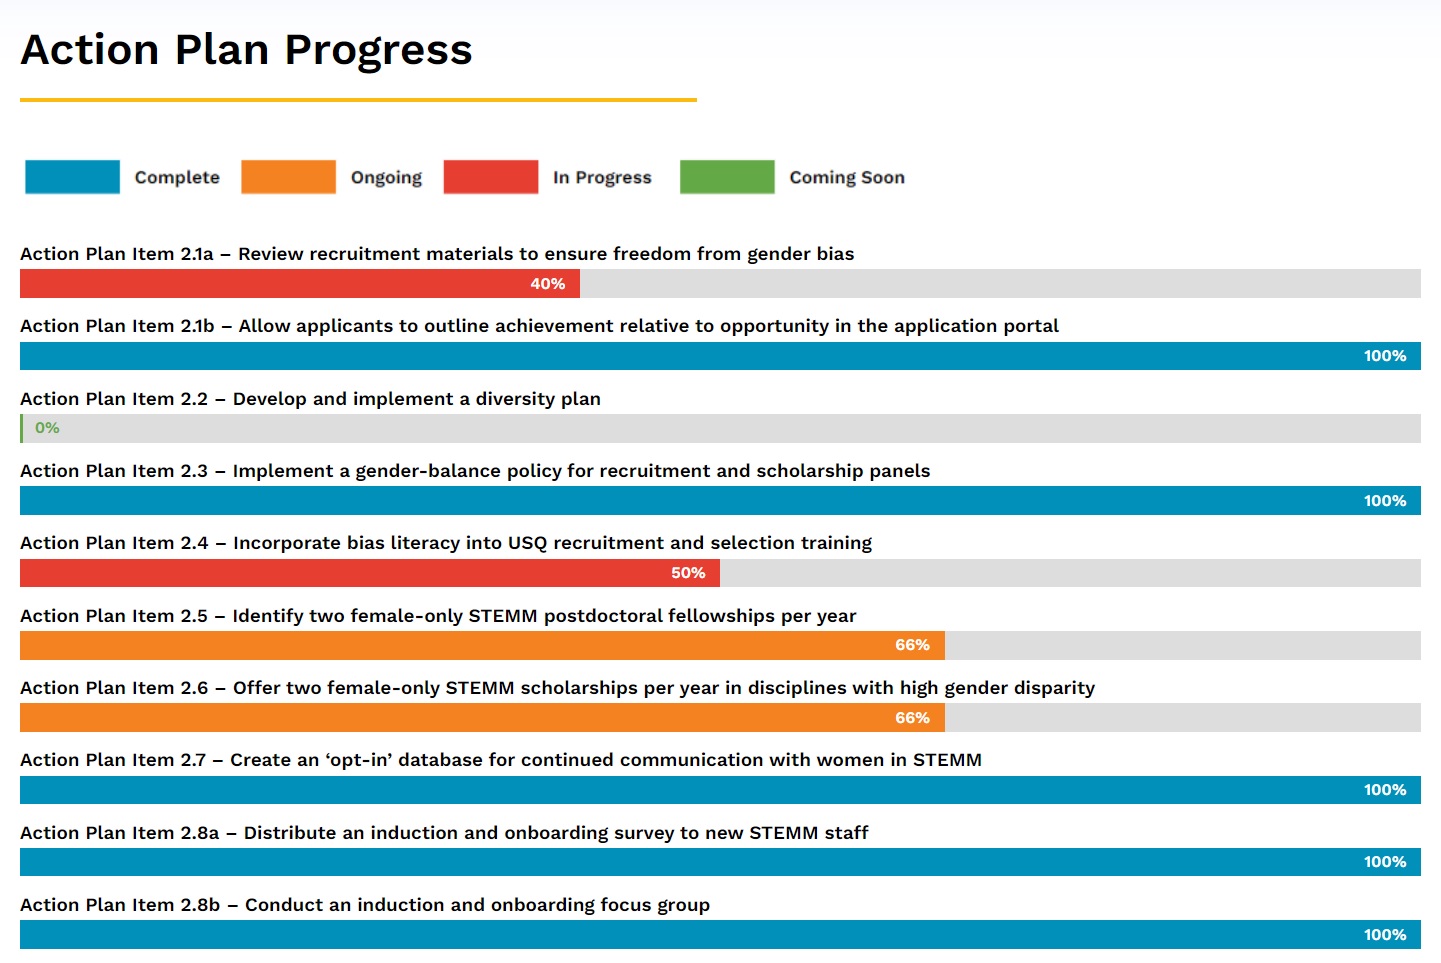
Each Action Plan Theme page includes a bar chart to highlight progress on specific actions. This supports accountability and provides university employees and leaders with a snapshot on program activities. The progress charts are updated every three months, just before the SAGE quarterly report is provided to UniSQ’s Vice-Chancellor’s Executive Committee.
Data analytics indicate the website attracts stable traffic, with peaks occurring in relation to SAGE marketing and communications efforts. The website attracts an overall higher percentage of new users (compared to returning UniSQ users), indicating consistently increasing engagement with the SAGE website from across the broader university.
Work is ongoing at UniSQ to improve the visibility of granular data relevant to the SAGE program and other EDI initiatives across the institution.
A major milestone in data visibility was achieved in early 2022 when the SAGE team and People Portfolio (UniSQ’s HR division) engaged the IT team to build new filters into the UniSQ Information Centre (USQIC). The USQIC is the University’s central source of Power BI data visualisation for data pooled from across the institution. The new filters now allow data about STEMM division staff profiles, performance planning and review, and academic promotion to be filtered by gender and STEMM discipline. This has greatly improved understanding of trends in staffing across the STEMM divisions and, consequently, which areas are improving in EDI and which areas need greater attention.
Next steps
The SAGE dashboard is updated quarterly to refresh and revise information in line with Action Plan progress and broader University feedback.
Work to improve data visibility via the USQIC is ongoing, with the aim of improving access to and understanding of EDI data for all university employees.