Research has consistently shown that equitable, diverse and inclusive workplaces are more productive and innovative, and achieve better outcomes.
Studies also show that systemic barriers have a negative effect on the attraction, retention and progression of women in academic and research careers.
The loss of such expertise is a waste of knowledge, skills and investment, and impacts our nation’s research performance and productivity.
To ensure we benefit from our top-quality academic and research talent, we need to ensure gender balance and diversity throughout the academic pipeline.
SAGE considers gender balance to be 40% women, 40% men, 20% people of any gender. Applying a 40:40:20 approach is inclusive of those identifying outside of the gender binary, which is a key principle of Athena Swan. Compared to a 50:50 approach, it also better accommodates minor fluctuations and is more realistic when working with small numbers.
Data from the Department of Education, Skills and Employment show that women continue to be underrepresented at senior levels in every field.
-
Natural and physical sciences
-
Engineering and related technologies
-
Architecture and building
-
Agriculture environmental and related studies
-
Health
-
Education
-
Management and commerce
-
Society and culture
-
Information technology
-
Creative arts
-
STEMM
-
STEM
Proportion of men and women by level in Natural and Physical Sciences
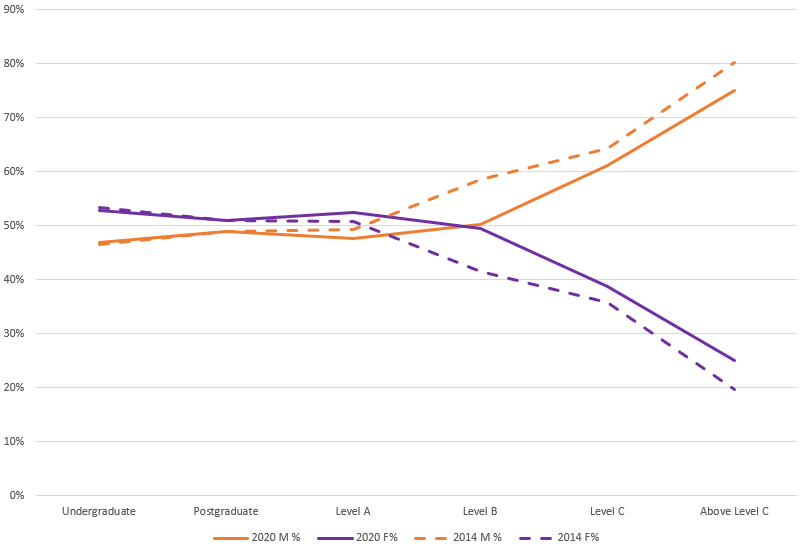
Table: Student enrolments (in headcount and percentage) and academic staff (in full-time equivalents and percentage) in 2014 and 2020, by level and gender, in natural and physical sciences. Source: Higher Education Statistics Collection, 2014 and 2020.
| 2020 | 2014 | |||||||||||
| Academic Level | Male | M% | Gender X | X% | Female | F% | Total | Male | M% | Female | F% | Total |
| Undergraduate | 45,957 | 47% | 142 | 0% | 51,690 | 53% | 97,789 | 8,672 | 47% | 9,961 | 53% | 18,633 |
| Postgraduate | 12,860 | 49% | 16 | 0% | 13,378 | 51% | 26,254 | 2,308 | 49% | 2,407 | 51% | 4,715 |
| Level A | 147 | 48% | 0 | 0% | 162 | 52% | 309 | 172 | 49% | 177 | 51% | 349 |
| Level B | 450 | 50% | 2 | 0% | 444 | 50% | 896 | 600 | 59% | 425 | 41% | 1,025 |
| Level C | 645 | 61% | 1 | 0% | 410 | 39% | 1,056 | 689 | 64% | 384 | 36% | 1,073 |
| Above Level C | 1,371 | 75% | 0 | 0% | 458 | 25% | 1,829 | 1,308 | 80% | 322 | 20% | 1,630 |
| GRAND TOTAL | 61,430 | 48% | 161 | 0% | 66,542 | 52% | 128,133 | 13,749 | 50% | 13,676 | 50% | 27,425 |
Proportion of men and women by level in Engineering and Related Technologies
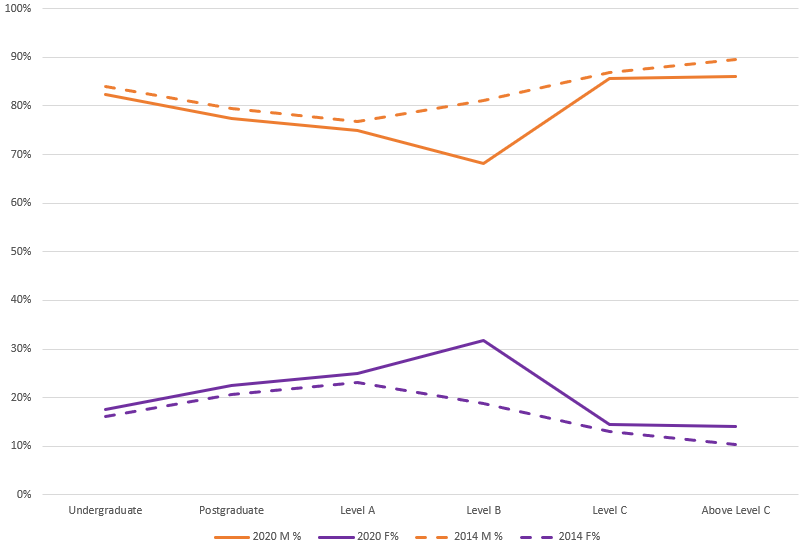
Table: Student enrolments (in headcount and percentage) and academic staff (in full-time equivalents and percentage) in 2014 and 2020, by level and gender, in engineering and related technologies. Source: Higher Education Statistics Collection, 2014 and 2020.
| 2020 | 2014 | |||||||||||
| Academic Level | Male | M% | Gender X | X% | Female | F% | Total | Male | M% | Female | F% | Total |
| Undergraduate | 65,756 | 82% | 63 | 0% | 14,070 | 18% | 79,889 | 10,887 | 84% | 2,081 | 16% | 12,968 |
| Postgraduate | 26,913 | 77% | 19 | 0% | 7,834 | 23% | 34,766 | 5,242 | 79% | 1,361 | 21% | 6,603 |
| Level A | 81 | 75% | 0 | 0% | 27 | 25% | 108 | 106 | 77% | 32 | 23% | 138 |
| Level B | 350 | 68% | 0 | 0% | 163 | 32% | 513 | 481 | 81% | 112 | 19% | 593 |
| Level C | 598 | 86% | 0 | 0% | 101 | 14% | 699 | 582 | 87% | 88 | 13% | 670 |
| Above Level C | 979 | 86% | 0 | 0% | 159 | 14% | 1,138 | 836 | 90% | 97 | 10% | 933 |
| GRAND TOTAL | 94,677 | 81% | 82 | 0% | 22,354 | 19% | 117,113 | 18,134 | 83% | 3,771 | 17% | 21,905 |
Proportion of men and women by level in Architecture and Building
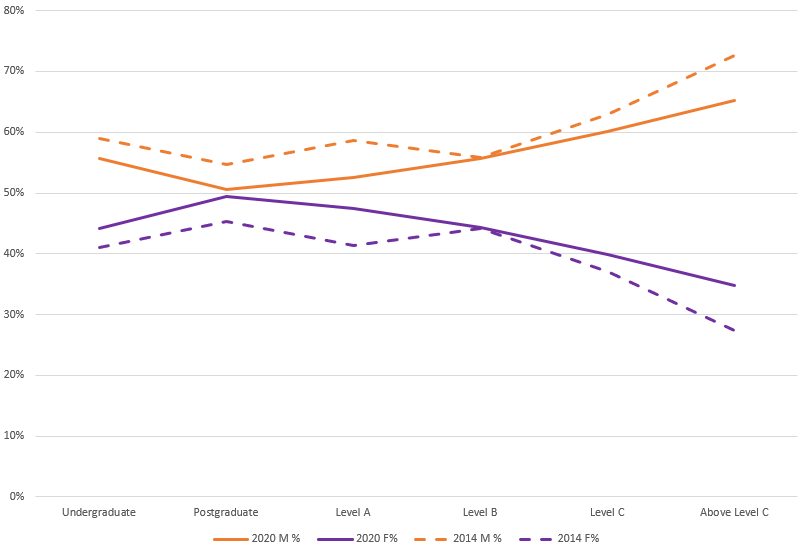
Table: Student enrolments (in headcount and percentage) and academic staff (in full-time equivalents and percentage) in 2014 and 2020, by level and gender, in architecture and building. Source: Higher Education Statistics Collection, 2014 and 2020.
| 2020 | 2014 | |||||||||||
| Academic Level | Male | M% | Gender X | X% | Female | F% | Total | Male | M% | Female | F% | Total |
| Undergraduate | 17,648 | 56% | 36 | 0% | 14,005 | 44% | 31,689 | 2,520 | 59% | 1,748 | 41% | 4,268 |
| Postgraduate | 5,743 | 51% | 5 | 0% | 5,607 | 49% | 11,355 | 1,430 | 55% | 1,186 | 45% | 2,616 |
| Level A | 21 | 53% | 0 | 0% | 19 | 48% | 40 | 17 | 59% | 12 | 41% | 29 |
| Level B | 143 | 56% | 0 | 0% | 114 | 44% | 257 | 106 | 56% | 84 | 44% | 190 |
| Level C | 134 | 60% | 0 | 0% | 89 | 40% | 223 | 122 | 63% | 72 | 37% | 194 |
| Above Level C | 133 | 65% | 0 | 0% | 71 | 35% | 204 | 111 | 73% | 42 | 27% | 153 |
| GRAND TOTAL | 23,822 | 54% | 41 | 0% | 19,905 | 45% | 43,768 | 4,306 | 58% | 3,144 | 42% | 7,450 |
Proportion of men and women by level in Agriculture Environmental and Related Studies
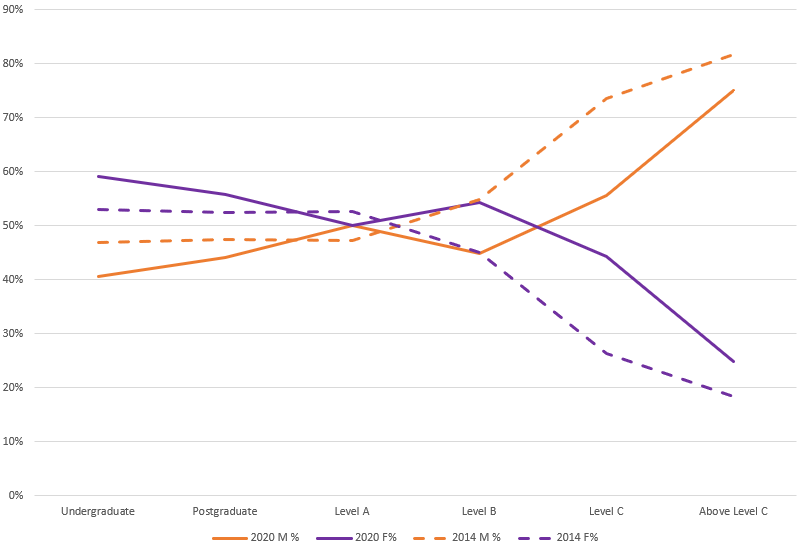
Table: Student enrolments (in headcount and percentage) and academic staff (in full-time equivalents and percentage) in 2014 and 2020, by level and gender, in agriculture environmental and related studies. Source: Higher Education Statistics Collection, 2014 and 2020.
| 2020 | 2014 | |||||||||||
| Academic Level | Male | M% | Gender X | X% | Female | F% | Total | Male | M% | Female | F% | Total |
| Undergraduate | 5,787 | 41% | 25 | 0% | 8,424 | 59% | 14,236 | 1,202 | 47% | 1,361 | 53% | 2,563 |
| Postgraduate | 3,138 | 44% | 11 | 0% | 3,962 | 56% | 7,111 | 806 | 47% | 891 | 53% | 1,697 |
| Level A | 13 | 50% | 0 | 0% | 13 | 50% | 26 | 26 | 47% | 29 | 53% | 55 |
| Level B | 57 | 45% | 1 | 1% | 69 | 54% | 127 | 84 | 55% | 69 | 45% | 153 |
| Level C | 84 | 56% | 0 | 0% | 67 | 44% | 151 | 131 | 74% | 47 | 26% | 178 |
| Above Level C | 187 | 75% | 0 | 0% | 62 | 25% | 249 | 187 | 82% | 42 | 18% | 229 |
| GRAND TOTAL | 9,266 | 42% | 37 | 0% | 12,597 | 58% | 21,900 | 2,436 | 50% | 2,439 | 50% | 4,875 |
Proportion of men and women by level in Health
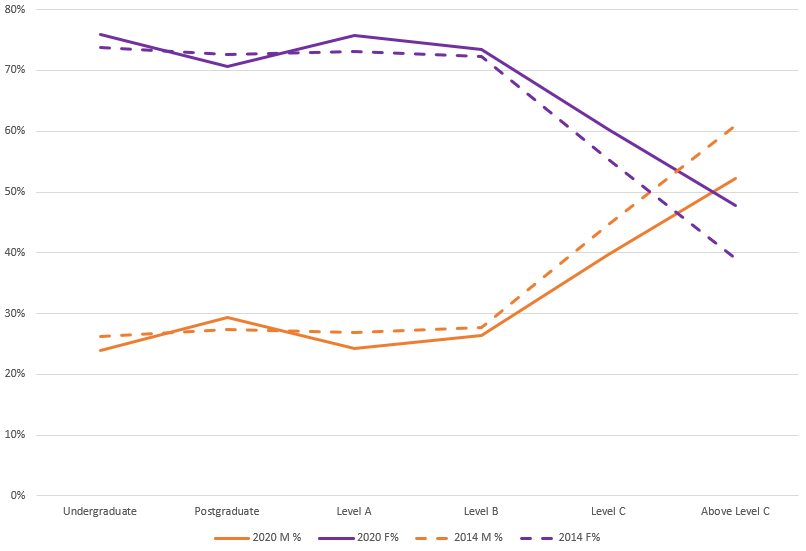
Table: Student enrolments (in headcount and percentage) and academic staff (in full-time equivalents and percentage) in 2014 and 2020, by level and gender, in health. Source: Higher Education Statistics Collection, 2014 and 2020.
| 2020 | 2014 | |||||||||||
| Academic Level | Male | M% | Gender X | X% | Female | F% | Total | Male | M% | Female | F% | Total |
| Undergraduate | 47,529 | 24% | 158 | 0% | 150,954 | 76% | 198,641 | 8,084 | 26% | 22,699 | 74% | 30,783 |
| Postgraduate | 22,484 | 29% | 54 | 0% | 54,074 | 71% | 76,612 | 4,635 | 27% | 12,306 | 73% | 16,941 |
| Level A | 101 | 24% | 0 | 0% | 316 | 76% | 417 | 135 | 27% | 366 | 73% | 501 |
| Level B | 551 | 26% | 1 | 0% | 1,533 | 74% | 2,085 | 529 | 28% | 1,384 | 72% | 1,913 |
| Level C | 570 | 40% | 0 | 0% | 865 | 60% | 1,435 | 609 | 45% | 755 | 55% | 1,364 |
| Above Level C | 887 | 52% | 1 | 0% | 810 | 48% | 1,698 | 1,004 | 61% | 642 | 39% | 1,646 |
| GRAND TOTAL | 72,122 | 26% | 214 | 0% | 208,552 | 74% | 280,888 | 14,996 | 28% | 38,152 | 72% | 53,148 |
Proportion of men and women by level in Education
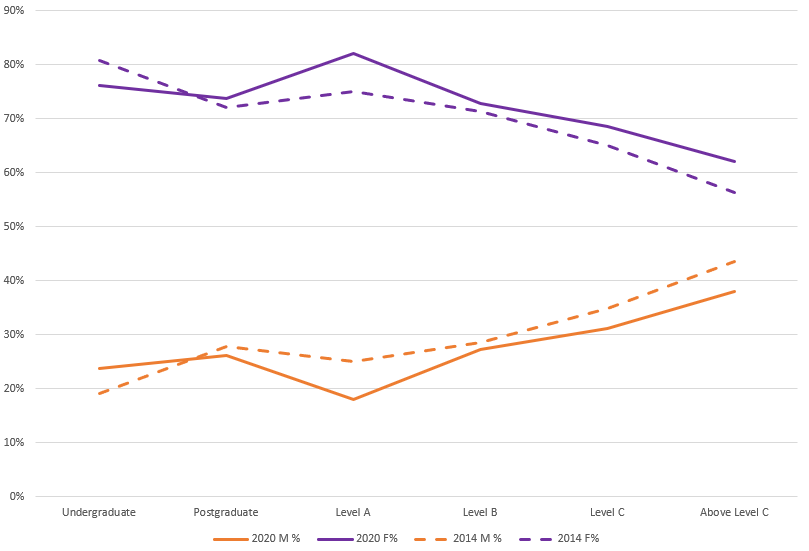
Table: Student enrolments (in headcount and percentage) and academic staff (in full-time equivalents and percentage) in 2014 and 2020, by level and gender, in education. Source: Higher Education Statistics Collection, 2014 and 2020.
| 2020 | 2014 | |||||||||||
| Academic Level | Male | M% | Gender X | X% | Female | F% | Total | Male | M% | Female | F% | Total |
| Undergraduate | 17,666 | 24% | 43 | 0% | 56,667 | 76% | 74,376 | 2,552 | 19% | 10,736 | 81% | 13,288 |
| Postgraduate | 12,861 | 26% | 67 | 0% | 36,167 | 74% | 49,095 | 5,227 | 28% | 13,540 | 72% | 18,767 |
| Level A | 18 | 18% | 0 | 0% | 82 | 82% | 100 | 26 | 25% | 78 | 75% | 104 |
| Level B | 196 | 27% | 0 | 0% | 523 | 73% | 719 | 262 | 29% | 653 | 71% | 915 |
| Level C | 163 | 31% | 1 | 0% | 358 | 69% | 522 | 194 | 35% | 362 | 65% | 556 |
| Above Level C | 167 | 38% | 0 | 0% | 273 | 62% | 440 | 180 | 44% | 233 | 56% | 413 |
| GRAND TOTAL | 31,071 | 25% | 111 | 0% | 94,070 | 75% | 125,252 | 8,441 | 25% | 25,602 | 75% | 34,043 |
Proportion of men and women by level in Management and Commerce
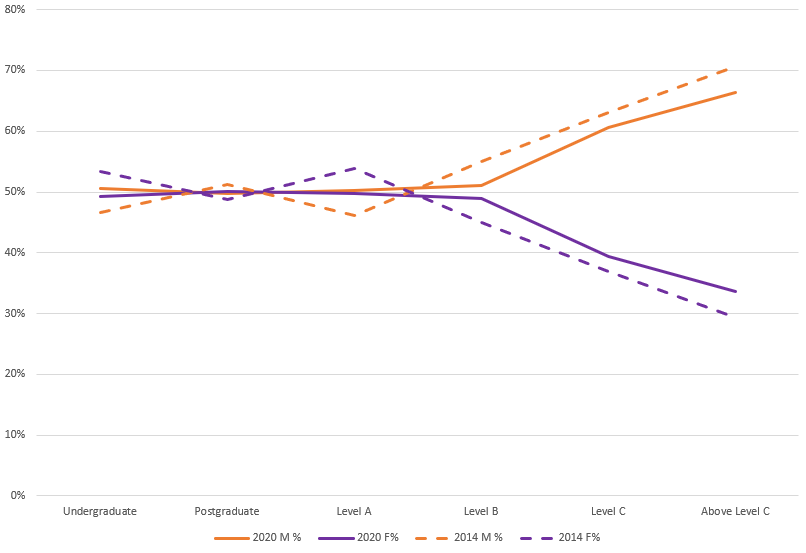
Table: Student enrolments (in headcount and percentage) and academic staff (in full-time equivalents and percentage) in 2014 and 2020, by level and gender, in management and commerce. Source: Higher Education Statistics Collection, 2014 and 2020.
| 2020 | 2014 | |||||||||||
| Academic Level | Male | M% | Gender X | X% | Female | F% | Total | Male | M% | Female | F% | Total |
| Undergraduate | 110,070 | 51% | 61 | 0% | 107,189 | 49% | 217,320 | 27,404 | 47% | 31,282 | 53% | 58,686 |
| Postgraduate | 70,133 | 50% | 53 | 0% | 70,646 | 50% | 140,832 | 19,805 | 51% | 18,791 | 49% | 38,596 |
| Level A | 118 | 50% | 0 | 0% | 117 | 50% | 235 | 102 | 46% | 119 | 54% | 221 |
| Level B | 687 | 51% | 1 | 0% | 658 | 49% | 1,346 | 696 | 55% | 569 | 45% | 1,265 |
| Level C | 656 | 61% | 1 | 0% | 426 | 39% | 1,083 | 598 | 63% | 351 | 37% | 949 |
| Above Level C | 760 | 66% | 0 | 0% | 385 | 34% | 1,145 | 668 | 71% | 277 | 29% | 945 |
| GRAND TOTAL | 182,424 | 50% | 116 | 0% | 179,421 | 50% | 361,961 | 49,273 | 49% | 51,389 | 51% | 100,662 |
Proportion of men and women by level in Society and Culture
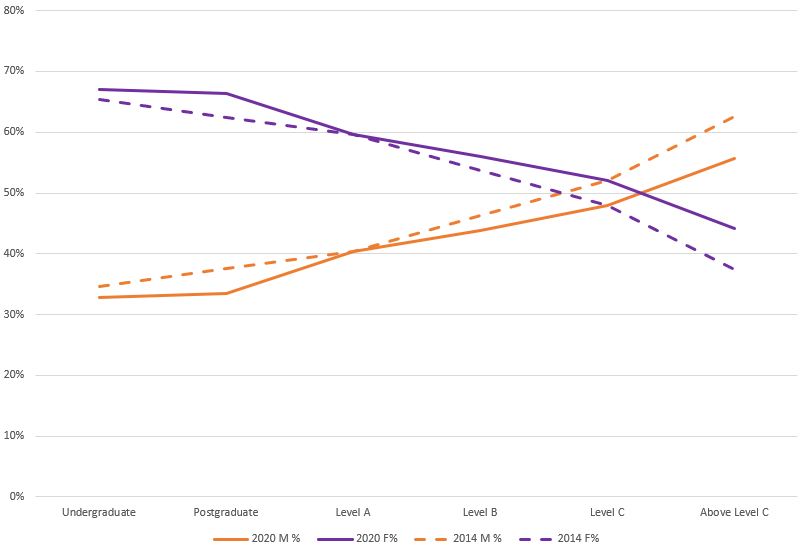
Table: Student enrolments (in headcount and percentage) and academic staff (in full-time equivalents and percentage) in 2014 and 2020, by level and gender, in society and culture. Source: Higher Education Statistics Collection, 2014 and 2020.
| 2020 | 2014 | |||||||||||
| Academic Level | Male | M% | Gender X | X% | Female | F% | Total | Male | M% | Female | F% | Total |
| Undergraduate | 73,446 | 33% | 398 | 0% | 149,781 | 67% | 223,625 | 13,747 | 35% | 25,893 | 65% | 39,640 |
| Postgraduate | 28,703 | 33% | 192 | 0% | 56,977 | 66% | 85,872 | 9,331 | 38% | 15,508 | 62% | 24,839 |
| Level A | 161 | 40% | 0 | 0% | 237 | 60% | 398 | 213 | 40% | 315 | 60% | 528 |
| Level B | 852 | 44% | 2 | 0% | 1,087 | 56% | 1,941 | 1,011 | 46% | 1,171 | 54% | 2,182 |
| Level C | 909 | 48% | 0 | 0% | 987 | 52% | 1,896 | 854 | 52% | 786 | 48% | 1,640 |
| Above Level C | 1,304 | 56% | 2 | 0% | 1,034 | 44% | 2,340 | 1,160 | 63% | 692 | 37% | 1,852 |
| GRAND TOTAL | 105,375 | 33% | 594 | 0% | 210,103 | 66% | 316,072 | 26,316 | 37% | 44,365 | 63% | 70,681 |
Proportion of men and women by level in Information Technology
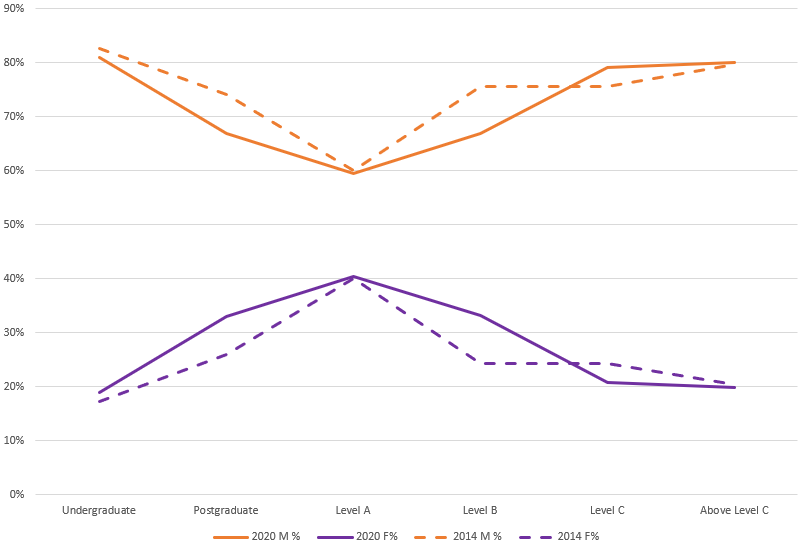
Table: Student enrolments (in headcount and percentage) and academic staff (in full-time equivalents and percentage) in 2014 and 2020, by level and gender, in information technology. Source: Higher Education Statistics Collection, 2014 and 2020.
| 2020 | 2014 | |||||||||||
| Academic Level | Male | M% | Gender X | X% | Female | F% | Total | Male | M% | Female | F% | Total |
| Undergraduate | 52,472 | 81% | 85 | 0% | 12,298 | 19% | 64,855 | 6,001 | 83% | 1,254 | 17% | 7,255 |
| Postgraduate | 34,143 | 67% | 16 | 0% | 16,898 | 33% | 51,057 | 3,734 | 74% | 1,307 | 26% | 5,041 |
| Level A | 47 | 59% | 0 | 0% | 32 | 41% | 79 | 30 | 60% | 20 | 40% | 50 |
| Level B | 347 | 67% | 0 | 0% | 172 | 33% | 519 | 205 | 76% | 66 | 24% | 271 |
| Level C | 354 | 79% | 0 | 0% | 93 | 21% | 447 | 220 | 76% | 71 | 24% | 291 |
| Above Level C | 466 | 80% | 0 | 0% | 116 | 20% | 582 | 230 | 80% | 59 | 20% | 289 |
| GRAND TOTAL | 87,829 | 75% | 101 | 0% | 29,609 | 25% | 117,539 | 10,420 | 79% | 2,777 | 21% | 13,197 |
Proportion of men and women by level in Creative Arts
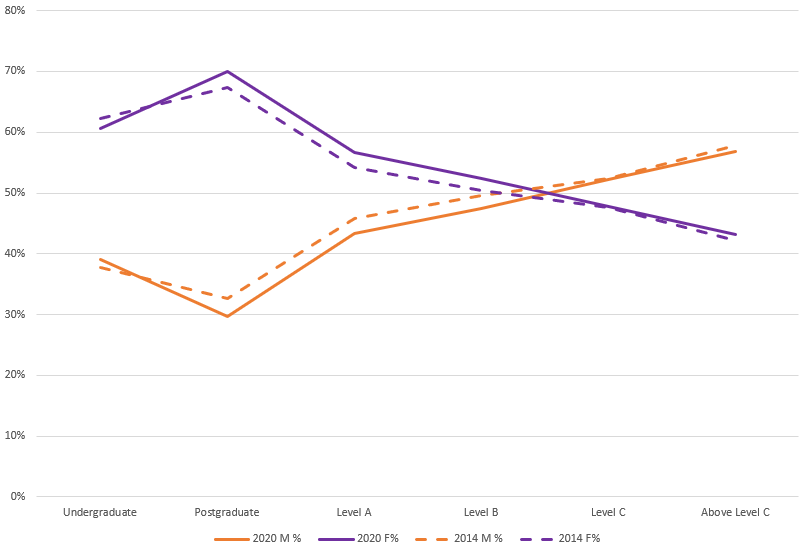
Table: Student enrolments (in headcount and percentage) and academic staff (in full-time equivalents and percentage) in 2014 and 2020, by level and gender, in creative arts. Source: Higher Education Statistics Collection, 2014 and 2020.
| 2020 | 2014 | |||||||||||
| Academic Level | Male | M% | Gender X | X% | Female | F% | Total | Male | M% | Female | F% | Total |
| Undergraduate | 29,451 | 39% | 259 | 0% | 45,778 | 61% | 75,488 | 6,489 | 38% | 10,701 | 62% | 17,190 |
| Postgraduate | 4,032 | 30% | 43 | 0% | 9,541 | 70% | 13,616 | 1,279 | 33% | 2,637 | 67% | 3,916 |
| Level A | 84 | 43% | 0 | 0% | 110 | 57% | 194 | 105 | 46% | 124 | 54% | 229 |
| Level B | 398 | 47% | 1 | 0% | 439 | 52% | 838 | 463 | 50% | 470 | 50% | 933 |
| Level C | 305 | 52% | 0 | 0% | 279 | 48% | 584 | 348 | 52% | 316 | 48% | 664 |
| Above Level C | 260 | 57% | 0 | 0% | 197 | 43% | 457 | 255 | 58% | 186 | 42% | 441 |
| GRAND TOTAL | 34,530 | 38% | 303 | 1% | 56,344 | 62% | 91,177 | 8,939 | 38% | 14,434 | 62% | 23,373 |
Proportion of men and women by level in STEMM
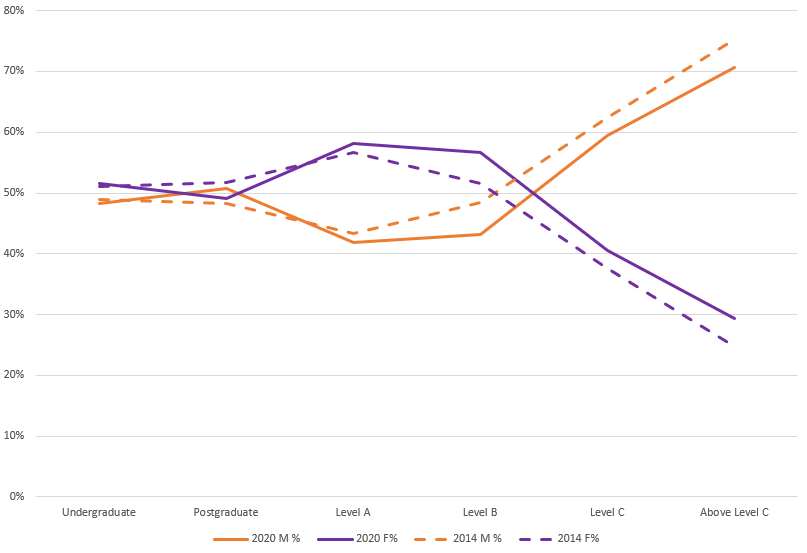
Table: Student enrolments (in headcount and percentage) and academic staff (in full-time equivalents and percentage) in 2014 and 2020, by level and gender, in STEMM disciplines. Source: Higher Education Statistics Collection, 2014 and 2020.
| 2020 | 2014 | |||||||||||
| Academic Level | Male | M% | Gender X | X% | Female | F% | Total | Male | M% | Female | F% | Total |
| Undergraduate | 235,149 | 48% | 509 | 0% | 251,441 | 52% | 487,099 | 37,366 | 49% | 39,104 | 51% | 76,470 |
| Postgraduate | 105,281 | 51% | 121 | 0% | 101,753 | 49% | 207,155 | 18,155 | 48% | 19,458 | 52% | 37,613 |
| Level A | 410 | 42% | 0 | 0% | 569 | 58% | 979 | 486 | 43% | 636 | 57% | 1,122 |
| Level B | 1,898 | 43% | 4 | 0% | 2,495 | 57% | 4,397 | 2,005 | 48% | 2,140 | 52% | 4,145 |
| Level C | 2,385 | 59% | 1 | 0% | 1,625 | 41% | 4,011 | 2,353 | 62% | 1,417 | 38% | 3,770 |
| Above Level C | 4,023 | 71% | 1 | 0% | 1,676 | 29% | 5,700 | 3,676 | 75% | 1,204 | 25% | 4,880 |
| GRAND TOTAL | 349,146 | 49% | 636 | 0% | 359,559 | 51% | 709,341 | 64,041 | 50% | 63,959 | 50% | 128,000 |
Proportion of men and women by level in STEM
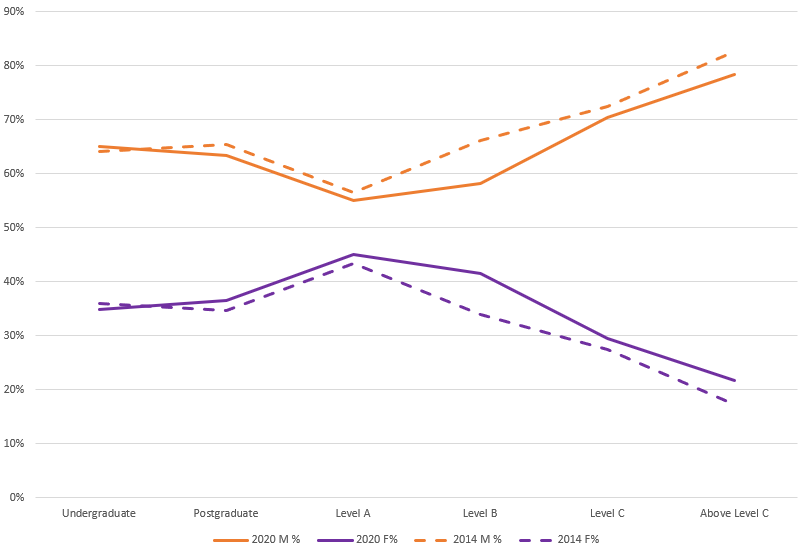
Table: Student enrolments (in headcount and percentage) and academic staff (in full-time equivalents and percentage) in 2014 and 2020, by level and gender, in STEM disciplines. Source: Higher Education Statistics Collection, 2014 and 2020.
| 2020 | 2014 | |||||||||||
| Academic Level | Male | M% | Gender X | X% | Female | F% | Total | Male | M% | Female | F% | Total |
| Undergraduate | 187,620 | 65% | 351 | 0% | 100,487 | 35% | 288,458 | 29,282 | 64% | 16,405 | 36% | 45,687 |
| Postgraduate | 82,797 | 63% | 67 | 0% | 47,679 | 37% | 130,543 | 13,520 | 65% | 7,152 | 35% | 20,672 |
| Level A | 309 | 55% | 0 | 0% | 253 | 45% | 562 | 351 | 57% | 270 | 43% | 621 |
| Level B | 1,347 | 58% | 3 | 0% | 962 | 42% | 2,312 | 1,476 | 66% | 756 | 34% | 2,232 |
| Level C | 1,815 | 70% | 1 | 0% | 760 | 30% | 2,576 | 1,744 | 72% | 662 | 28% | 2,406 |
| Above Level C | 3,136 | 78% | 0 | 0% | 866 | 22% | 4,002 | 2,672 | 83% | 562 | 17% | 3,234 |
| GRAND TOTAL | 277,024 | 65% | 422 | 0% | 151,007 | 35% | 428,453 | 49,045 | 66% | 25,807 | 34% | 74,852 |
Selected notes on the data
In our tables, “Gender X” refers to staff members or students who have requested their gender to be recorded as neither male nor female.
Due to the small number of Gender X individuals and lack of disaggregated data for Gender X students (see student data notes below), we have included the figures for Gender X in the tables but not the corresponding charts. In future, we hope to provide charts and tables with figures for all genders as better data become available.
Student data
- Gender representation for students were calculated using 2014 enrolments data from uCube and 2020 student enrolments pivot table. Both data sources were published by the Department of Education, Skills and Employment. The data extracted were enrolment numbers by broad field of education (primary), by broad course level, by year, by gender.
- Prior to 2020, the Department of Education, Skills and Employment’s count of female students includes students who have requested their gender to be recorded as neither male nor female. Disaggregated data for students who recorded a gender other than male or female is only available from 2020 onwards.
- Discipline areas are based on Field of Education, as defined by the Department of Education, Skills and Employment.
- For the complete data notes, please refer to uCube or the explanatory notes in the pivot table.
Staff data
- Staff data were extracted from “Full-time Equivalence of Staff by Academic Organisational Groups”, Department of Education, Skills and Employment, Staff Time Series. The data were viewed as full-time equivalents by Academic Organisational Unit (AOU), by current duties classification, by year, by gender. All work contract types (full-time and fractional full-time) and current duties terms (tenurial term, limited term, other term) were included.
- Discipline areas are based on AOU Groups, as defined by the Department of Education, Skills and Employment.
- As these charts were based on AOU staff data, only staff with “teaching only” or a “teaching and research” function are included.
- While we have not presented the 2014 count of Gender X staff in our tables, these figures are available from the Staff Time Series.
- For the complete data notes, please refer to “Definitions and Notes” in the Department of Education, Skills and Employment’s Staff Time Series.
Version history
- The charts and tables on this page were published on 11 August 2023.
- The version published on 25 May 2021 contained graphs comparing the gender profile by discipline in 2014 and 2019. In that version, the gender profiles for students were calculated using completions data.
- Prior to 25 May 2021, this page contained graphs of gender profile by discipline in 2014. Please note that the pre-May 2021 graphs were based on a different 2014 data set obtained by request from the Department of Education and Training, and were not identical to the 2014 data nor comparable to the 2020 data shown here.
Feedback
We care about the accuracy of our charts and tables. If you spot an error, please let us know.
Join our mailing list
Validate your email
Full access to our website is limited to our subscribers.
If you are a staff member or student at a SAGE subscriber institution, please enter your institutional email address and we will send you a validation link.
